Tracking ROI With Google Analytics
As a business owner, visualizing the profits of your marketing campaign is extremely important. If you have an e-Commerce shopping website, then it is absolutely critical to have an exact ROI figure that you can analyze regularly. luckily, Google Analyics and Google Adwords data provides you with what you need to track that ROI figure with ease. Today I will be going over a few different ways to gather cost and spend data in a way that will provide you with valuable insights that you may not have thought existed. We will go some of the great features that GA has to offer like the Multi-Channel Attribution Reports, Top Conversion Path Reports and Assisted Conversion Reports. With these reports and a few cost reports from Adwords, we can very closely begin to see what the ROI of your marketing campaigns. Let’s get started.
First, what you are going to need to have open in order to do this is obviously Google Analytics, Google Adwords and ideally you should probably use excel to organize this data but there are many ways to create your own custom ROI Reports. Lets start with the basics, figuring out how to calculate ROI which is easy. The formula is return minus cost, then taking that difference and dividing it by the cost. For those visually strong learners, below is a visual representation of how to calculate ROI.
![]()
Gathering Your Data With Online Marketing Tools
So, now that we all know how to calculate ROI, lets start from the top. First, we need to understand what our gain from the investment was. Which sounds easy but in this elaborately sophisticated, multi-channel marketing world it can mean combining several reports from a several places. If you aren’t efficient with using your marketing tools, this may take a while for you, for those of you who are experienced and that have familiarity with your tools, this should be a cinch. For the sake of brevity, lets just say that you are a eCommerce website owner and you are only using Google Adwords as your current form of marketing. Let’s also say assume that you are equipped with a few years eCommerce PPC management experience, specifically through Google Products like Analytics and Adwords.
Gathering Your Ecommerce Revenue Data
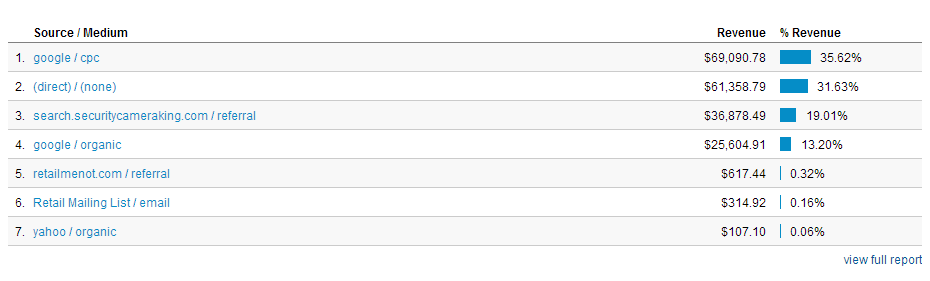
Now for most of you, figuring out the total revenue generated from your PPC campaign may sound like a simple and easy task. I am not here to tell you otherwise, I am just sharing how we go about generating ROI reports here at the top ranked Florida SEO company. We go a step further than most search marketing firms, we take a look at many factors that many business owners do not even know exist. So, lets get started by getting the revenue generated from your PPC campaign. To do this, you can simply go to your Analytics account and pull the revenue by medium report. This report will show you the revenue generated from each medium that you are using for advertising your products. If you click into the CPC category, you can then apply a secondary dimension of “campaign” or “medium” to analyze the data at a deeper level. Once you have the revenue generated from each campaign or Adgroup depending on how you like to analyze your data, you should have this exported into excel so that we can begin to calculate true ROI. Its important to note that the revenue in this report is attributed to the medium that was used during the visit in which the purchase took place, which leads me to my next step in the ROI reporting process.
Learn How To Use Assisted Conversion Reports!
What Are Assisted Conversion Reports?
Needless to say tracking the revenue generated from an E Commerce website is critical but the more importantly, tracking the revenue accurately is imperative. To accurately track the revenue generated from a eCommerce PPC campaign you must know how to use assisted conversion reports. For those of you who don’t already know, Google Analytics attributes the revenue generated from a visitor to the medium that was used during that visit. What does that mean? Let’s create a hypothetical scenario, lets say Joe searches for a product on Google. Let’s say the product results page on Google’s sponsored section (PPC) showed three websites that had the exact products that Joe wanted. Joe, like many consumers clicked on the first 3 results and checked out the sites and pricing before making his purchase like a wise consumer should. The first website he visited ended up being the site that he chose to purchase the product from however, Joe took a few days to make his purchase after shopping around because his wife interrupted the shopping process when she asked him to fix the sink which suddenly started leaking. When Joe finally made the purchase 2 days later, he didn’t use Google to find the website he liked, he went directly to the website which he saved in his favorites. What happened was that Joe made a purchase during a direct visit, not a PPC visit (aka CPC) so Google attributed that direct revenue to the direct medium not the PPC medium when in reality, PPC played a critical role in the conversion process. Now you should be able to understand just how powerful the assisted conversion reports are to you, especially if you are selling products online.
Using Assisted Conversion Reports To Calculate ROI
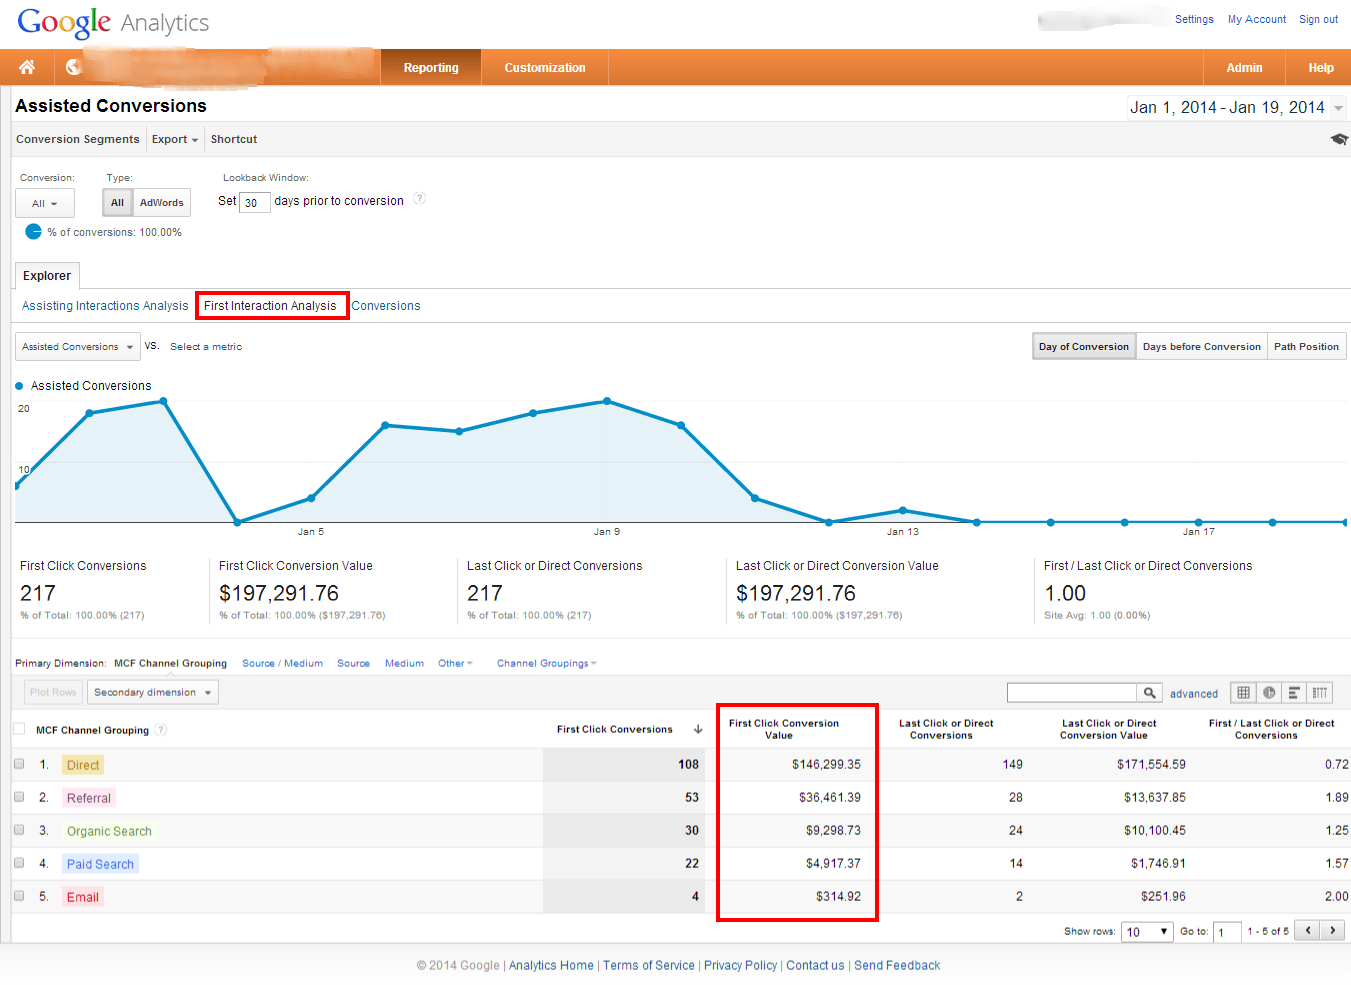
When it comes to tracking ROI for an eCommerce SEO or PPC campaign, in my opinion, you must include the revenue from assisted conversions that drive revenue. Let’s take a look at how to do this. Under conversions > Multi Channel Funnels you can click on “Assisted Conversions” and find a linear graph with the option to choose “first click analysis” which will show you metrics associated with how those mediums/sources contributed towards conversions. The report is generated by tagging each visitor with a unique cookie Id which then allows Google to know which medium was used as the first interaction for each visitor who made more than one visit before making a purchase, hence the name “First Click Interaction”. The screen shot below is an example of what this report looks like for a ecommerce PPC campaign with a large budget. As you can see, each of the mediums played a role in the conversions process for those transactions that took more than one visit.
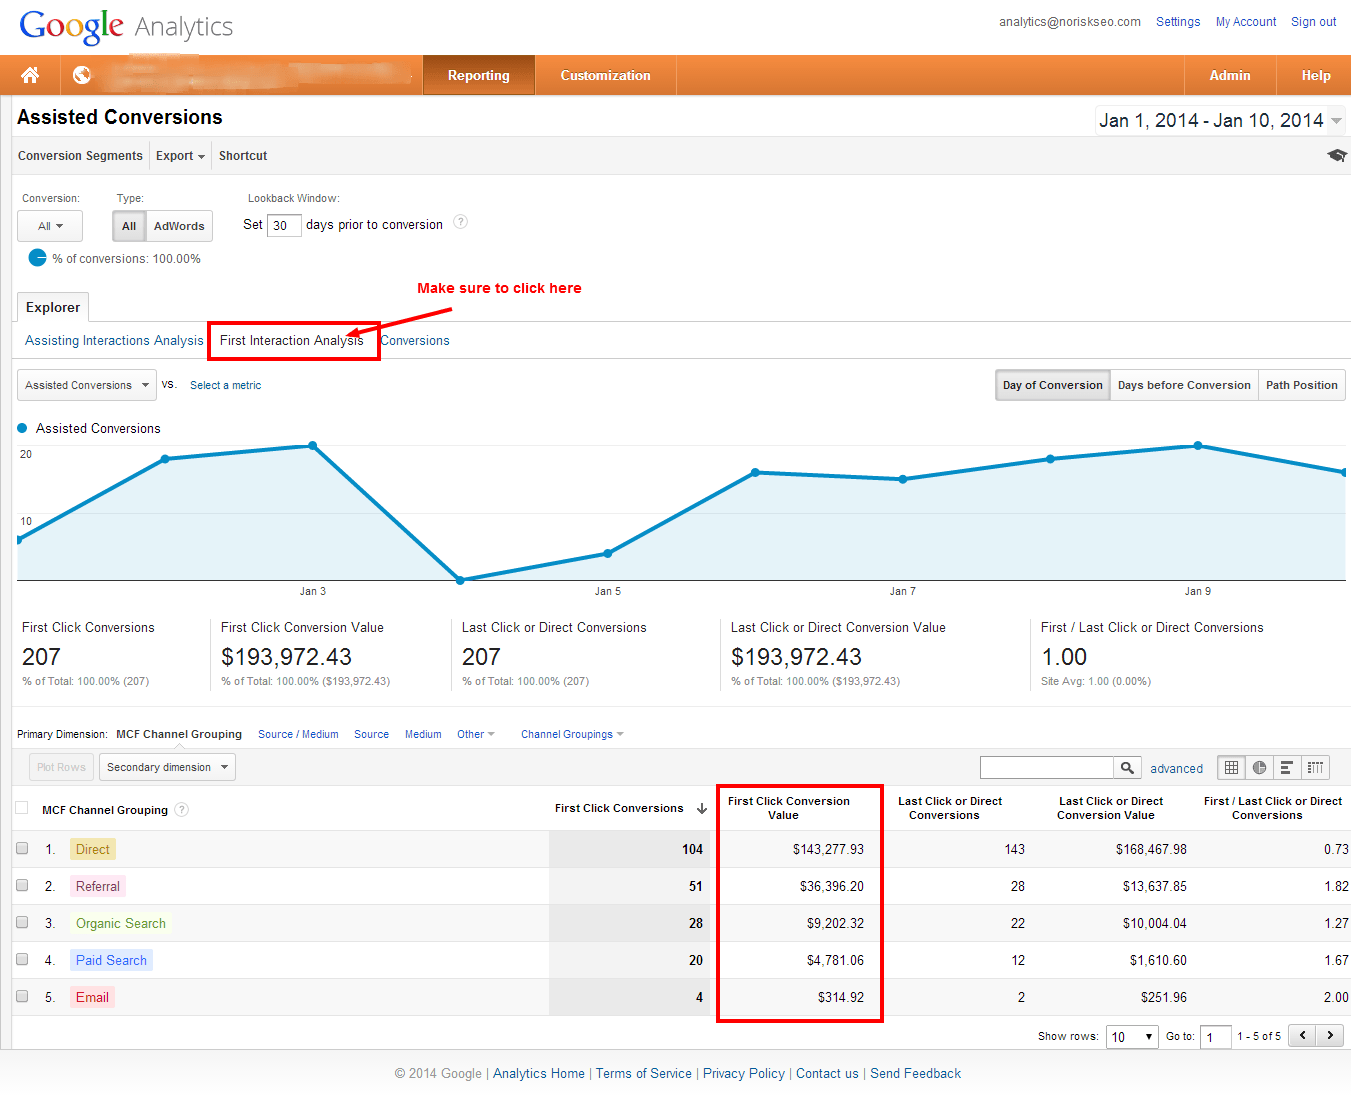
Remember, these reports only show data pertaining to the conversions that took more than one visit to generate the transaction. You can analyze this data on a campaign level, ad group level and many other secondary dimension options, once you have the data to your liking you should also export this into excel along with your original revenue report from the previous step.
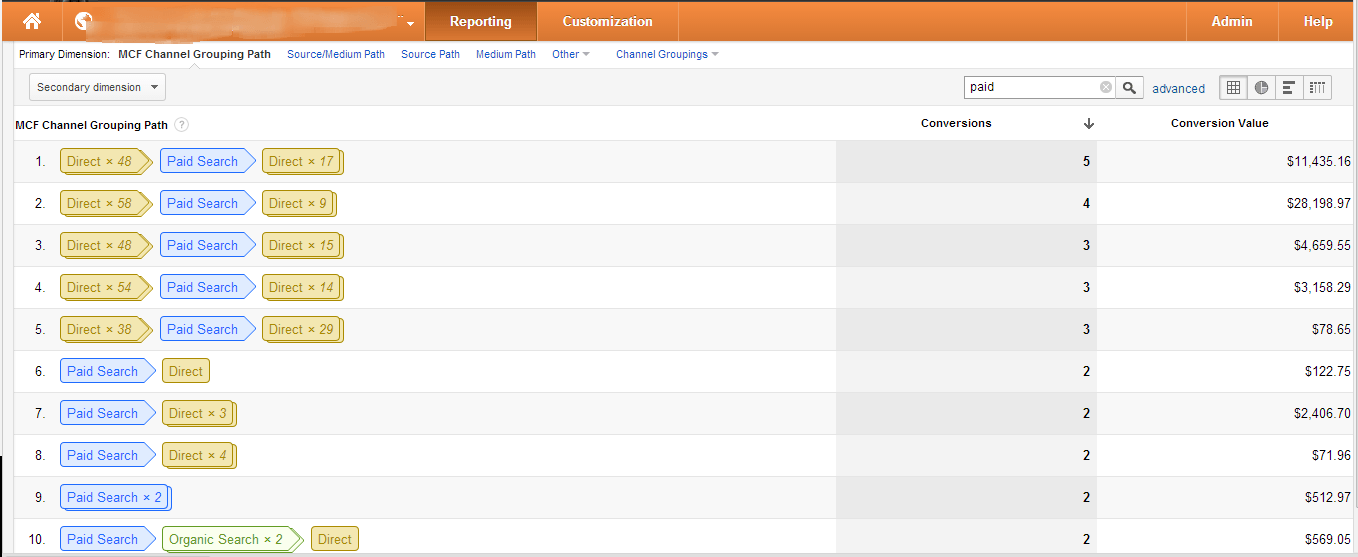
There is another great way to look at this data which can help you make strategic decisions on improving your campaign/medium performance with the Top Conversion Path reports. The conversion path reports show you the popular paths that visitors took during the conversion process with a easy to understand graphic table as shown below. Its worthy to note that by typing a medium name like “paid” in the search field above the table as shown in the image allows you to hone in on paths that contain a specific medium, you can use the advanced search to make even better use of your filters.
Conversion Path Report
Calculating ROI
After you have the two revenue reports generated and in an excel work book, you can manage to create custom reports in many ways. An example is shown below which is a pretty simple way to show ROI with once time visit revenue and multi-channel funnel revenue taken into consideration.
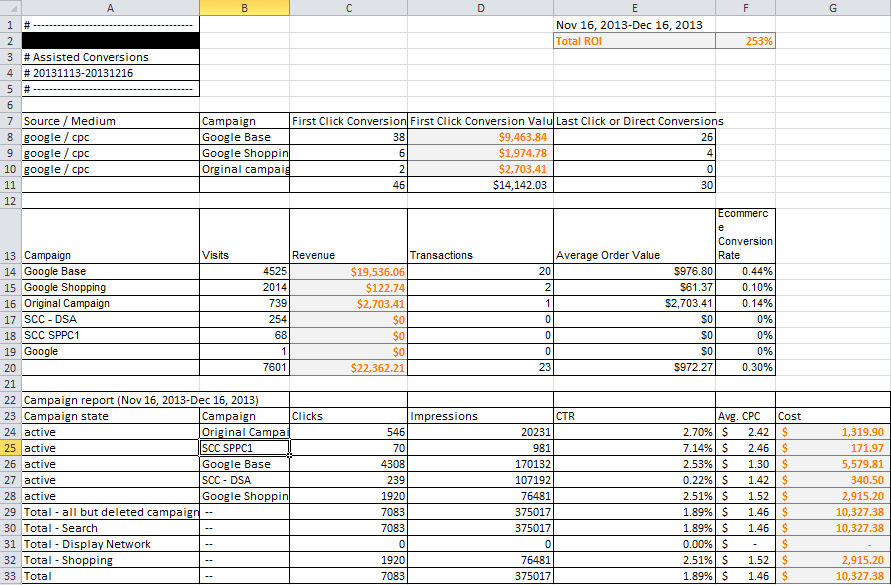
The only thing you need to do is log into your Adwords account to pull the cost of your Adwords campaign which can be done in many ways from a campaign level to a keyword level. In the example above we took the cost and broke it down into a campaign level so that we can see how profitable each campaign was. Some cases require that we can break the cost down to a ad group level. Either way, you can track ROI pretty meticulously with these types of reports, and we just scratched the surface. To learn more about tracking ROI, I would recommend giving us a call!
Taking Things Even Further!
Now that we know how to track revenue for eCommerce sites, we should also talk about other ways to measure revenue. For example phone calls. Lets just say for every 10 phone calls your company gets from your website, you acquire 3 new clients. If we know what your phone call conversion rate is and how much each client is worth at the bare minimum we can also start to factor in things like revenue from phone calls and even form submissions from your websites request a quote page for example.
Thanks to the innovation behind marketing technology, we have very robust software tools that allow us to track things like phone call and form submissions and whats even better is that Google Analytics can integrate this data into its reporting. Today, we are going to end this blog post with what we have covered, but for our next post, we will take what we have learned and incorporate phone call reports and online form submissions into our ROI reports! These are just some of the techniques that we use to provide professional reports to our clients, I have yet to meet another Fort Lauderdale SEO company to do this.
About The Author

Jason Hawkins / http://www.themiamiseocompany.com
Jason Hawkins is the CEO & Co-Founder of The Miami SEO Company. He has over ten years of experience in search engine optimization, conversion rate optimization and lead generation. His core responsibilities include identifying ways to increase value of services rendered, training staff on advanced SEO topics, and A/B testing internal processes to consistently improve client return on investment.


